
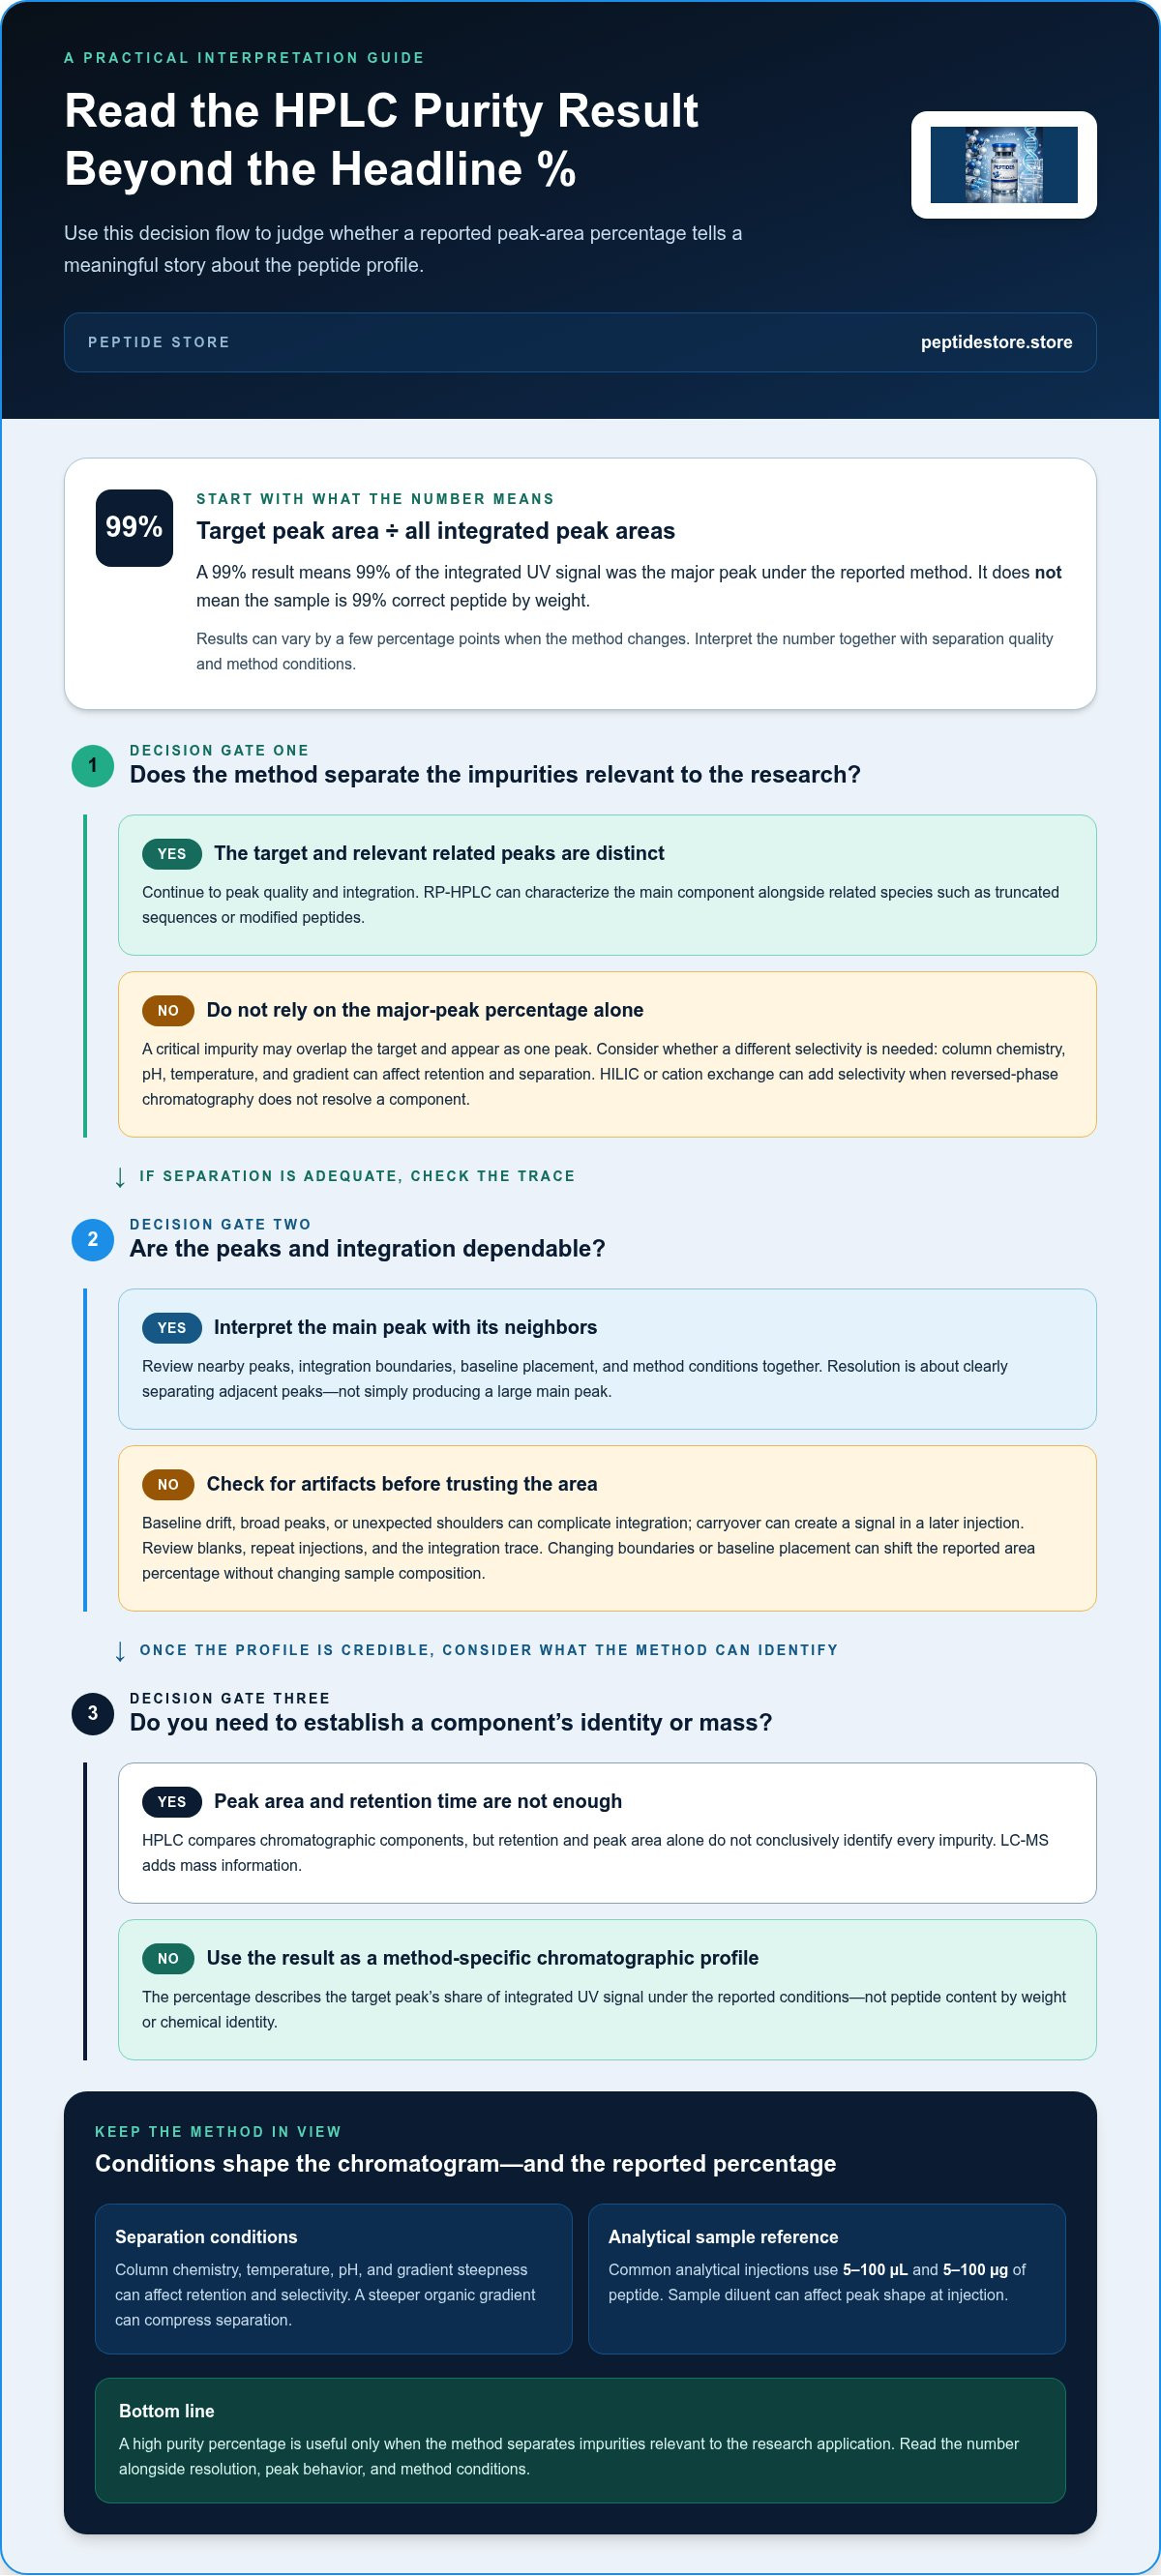
Peptide purity HPLC analysis calculates the target peak area as a percentage of all integrated peak areas. A 99% result means that 99% of the integrated UV signal was the major peak under the reported method, not that the sample is 99% correct peptide by weight. Results can vary by a few percentage points when the method changes.
That distinction matters: a high percentage is useful only when the method separates impurities relevant to the research application. RP-HPLC characterizes a peptide’s chromatographic profile, helping assess the main component and related species such as truncated sequences or modified peptides.
This article explains how RP-HPLC purity is calculated, what chromatographic resolution should show, and how sample quantity, column chemistry, and gradient conditions affect the result. It also explains how purity requirements vary by research application, helping you interpret an HPLC report in context instead of relying on the headline percentage alone.
Key Takeaways
- Interpret an HPLC purity percentage as the target peak’s share of integrated UV signal, not as the sample’s peptide content by weight.
- Assess chromatographic resolution by whether the method can distinguish relevant process- and degradation-related species, not only by the size of the main peak.
- Use the typical analytical injection range of 5-100 µL and 5-100 µg of peptide as a starting reference; detection wavelength and sample concentration also shape the analysis.
- Evaluate column chemistry, temperature, and gradient together because each can affect retention and separation selectivity.
- Match the purity target to the application: the article compares recommendations for screening, biochemical assays, and more sensitive quantitative or structural work.
What Is Peptide Characterization by RP-HPLC?
Reversed-phase HPLC (RP-HPLC) separates peptide mixtures according to their chromatographic behavior, producing a profile that can be used to assess the target and related components. Temperature, pH, column chemistry, and the organic-solvent gradient all influence that profile.
Watch this video for a visual overview of peptide detection reports:
How Reversed-Phase HPLC Separates Peptides
RP-HPLC separates peptides through differing interactions with a nonpolar stationary phase and a polar liquid mobile phase. As acetonitrile increases in the mobile phase, peptide components elute according to their retention. A C18 column is a common starting point, with water and acetonitrile forming the gradient and an acidic modifier supporting consistent behavior. This chemical separation matters because a chromatogram can reveal related components that a single bulk measurement would not distinguish.
Selecting Stationary Phases and Column Chemistry
Stationary-phase selection determines how strongly peptides interact with the column and how effectively related species separate. Method development commonly begins by screening a typical alkyl phase, then comparing alternative column chemistries when selectivity is inadequate. C18 is widely used, while C8 can offer different selectivity for very hydrophobic peptides. A typical peptide column uses porous silica particles measuring 3-5 µm. This comparison matters because a column that retains the target may still fail to resolve a closely related impurity.
Temperature, pH, and Sample Diluent Effects
Temperature and mobile-phase pH change peptide retention and selectivity, while the sample diluent can affect peak shape at injection. A technical method-development range is 40-90 °C; an illustrated peptide method runs at 65 °C. pH is identified as the variable with the most dramatic impact on selectivity. Typical mobile phase contains 0.1% trifluoroacetic acid. For sample preparation, dissolve the peptide in a diluent compatible with the starting mobile phase; analytical injections commonly use 5-100 µL and 5-100 µg. These choices matter for reproducible peaks.
Retention Time and Peak Resolution Factors
Retention time and peak resolution depend on peptide hydrophobicity, stationary-phase chemistry, temperature, pH, and gradient steepness. A small pH change can alter selectivity, while a steeper organic gradient can compress separation. In peak-area analysis, consistent integration boundaries and baseline placement matter because reported purity reflects integrated UV signal, not peptide content by weight. HPLC compares chromatographic components; LC-MS adds mass information, capillary electrophoresis separates by electrophoretic mobility, and amino acid analysis measures composition. These methods answer different analytical questions.
What chromatographic resolution is expected for peptide APIs?
For peptide APIs, resolution should distinguish process-related and degradation-related species, rather than simply produce a large main peak. The key is whether the method separates impurities relevant to the batch profile.
Interpreting Peak Areas and Resolution
A chromatogram shows detector response over elution time. Peak areas help compare the main component with detected related substances, but area alone does not establish a peak’s chemical identity or mass. For example, two compounds that co-elute may appear as one peak, leaving the profile incomplete. Interpret the main peak alongside nearby peaks, integration boundaries, and method conditions.
Resolution describes how clearly adjacent peaks are separated. No single resolution value suits every peptide API: the method needs to resolve relevant synthesis-related and degradation-related species. A high main-peak percentage does not prove adequate separation if a critical impurity overlaps it. Compare chromatograms under consistent conditions and assess whether the target and impurities of interest produce distinct signals.
Alternative Selectivity: HILIC and Cation Exchange
Hydrophilic interaction chromatography (HILIC) and cation-exchange chromatography use separation mechanisms different from reversed-phase methods. HILIC can retain polar analytes under suitable mobile-phase conditions, while cation exchange separates species through charge interactions. These methods can add selectivity when a reversed-phase chromatogram does not resolve a particular component.
Column specifications affect the separation. Mono S HR 5/5 is a strong cation-exchange column with 10 μm particles. Polysulfoethyl A is specified as a strong cation-exchange column with 5 μm particles, 300 Å pores, and dimensions listed as “200 2.1 mm ID.” These examples illustrate distinct stationary-phase options, not universal performance rankings. Selectivity depends on peptide charge, composition, and method conditions.
Recognizing Chromatogram Artifacts
Baseline drift, broad peaks, and unexpected shoulders can complicate area integration. A shoulder may indicate partial separation, while a broad peak can conceal a nearby minor component. Carryover can also produce a signal in a later injection. Review blanks, repeat injections, and the integration trace to distinguish a reproducible analyte signal from an analytical artifact. Changes to the baseline or integration boundaries can shift reported area percentages without changing the sample composition.
Limits of HPLC for Impurity Identification
HPLC detects separated components using the selected detector, but retention and peak area alone do not conclusively identify every impurity or modification. Co-elution and weak detector response can limit detection, so LC-MS or another orthogonal technique may be needed to provide evidence about molecular mass or composition.
How much sample is needed for HPLC purity analysis?
Analytical HPLC typically uses 5-100 µL of sample per injection, corresponding to 5-100 µg of peptide. The amount depends on sample concentration and the method’s injection conditions. These ranges provide a practical reference, not a universal setting: the injected material must produce a measurable signal without overloading the column. For a limited sample, start by considering the method’s detection sensitivity and the concentration needed to keep peaks within the detector’s useful response range.
Sample Preparation and Injection Amount
Prepare a homogeneous sample solution before injection, using a diluent compatible with the initial mobile phase. A sample diluent with a high organic-solvent content can disrupt focusing at the column inlet, broadening peaks or altering their shape. In reversed-phase HPLC, the sample plug should be similar to the starting mobile phase. Keep preparation and injection conditions consistent across repeat runs so any differences in peak profiles reflect the material, not variable handling.
Injection volume and peptide mass are related, but they are not the same. A dilute solution may require a larger volume to deliver a measurable quantity; a concentrated solution can deliver the same mass in less volume. Excess mass can broaden or distort peaks, while too little may leave minor impurities below the method’s detection capability. The right balance depends on the column, detector response, and sample concentration.
Choosing a UV Detection Wavelength
Peptide purity is commonly measured by UV detection at 214 nm or 220 nm, where peptide bonds absorb. An illustrated peptide-analysis method uses UV-Vis detection at 220 nm. Using one wavelength consistently supports comparison across samples analyzed by the same method, but the chromatogram still represents detected UV response rather than total sample mass.
Aromatic amino acid side chains absorb around 280 nm. That wavelength can provide information for peptides containing aromatic residues, but it may not capture all peptide species with equal sensitivity. Select the detection wavelength based on the peptide’s composition and the analytical purpose. A wavelength that highlights the target may respond differently to a chemical impurity, affecting its apparent peak area.
Interpreting the Detected Signal
For peptide purity HPLC analysis, peak areas show the relative share of detected UV signal under the stated method. They do not directly quantify net peptide content in dried material. A sample may contain water, salts, or other material that adds weight but not to the peptide’s integrated UV peaks. Quantitative amino acid analysis measures net peptide content, while HPLC profiles separated components.
Detection also depends on whether molecules absorb at the selected wavelength and separate from neighboring species. For example, a low-level impurity that co-elutes with the main peak may not appear as a distinct signal. Record the injection volume, peptide mass, diluent, and wavelength for each chromatogram. These details make results easier to interpret and compare across controlled analytical runs.
C18 columns and gradient elution
A C18 column and an increasing organic-solvent gradient form a common starting point for peptide profiling. Column dimensions, particle size, and gradient slope affect retention and separation. A typical peptide HPLC column measures 50-250 mm in length and 2.1-4.6 mm in internal diameter. These variables matter because related impurities may elute close to the target sequence, requiring conditions that separate neighboring peaks.
Column dimensions and stationary phase
C18 stationary phases retain peptides through hydrophobic interactions, while mobile-phase composition controls their elution. Typical peptide columns use porous silica particles measuring 3-5 µm. A longer column can provide more separation distance, while internal diameter influences the flow and sample loading appropriate for the method. One illustrated configuration uses a 250 x 4.6mm Kinetex EVO C18 5µm column. Column selection should support the profiling goal, not simply reproduce a familiar specification.
Peptide sequence and hydrophobicity influence retention on C18. If a very hydrophobic peptide or related species doesn't separate adequately, a different stationary-phase chemistry, such as C8, can change selectivity. Compare chromatograms under controlled conditions to determine whether altered retention improves resolution. Column chemistry and dimensions work together; changing both at once makes it harder to identify which technique caused a different peak pattern.
Gradient slope and organic-solvent range
Gradient elution gradually increases organic solvent, commonly acetonitrile, to move retained peptides through the column. A typical starting gradient increases organic solvent by 1% B per minute. Peptide methods commonly raise acetonitrile from about 5% to about 60% over 15-60 minutes. A shallower gradient spreads elution across more time and can separate components that otherwise overlap. A steeper gradient shortens the run but may compress related peaks.
A suggested peptide-analysis gradient reaches 50-60% organic solvent, where all peptides should elute. The endpoint and slope should suit the sample’s retention range. If the gradient stops too early, strongly retained material may remain on the column. A final high-organic wash can help elute retained components before the next injection, while re-equilibration restores the starting conditions for consistent profiling.
Reading an example method
An illustrated method uses a 14-34% B gradient over 40 minutes, followed by a ramp to 80%. This example shows a shallow separation stage followed by a stronger organic increase. It is not a universal peptide method: peptide sequence, related impurities, and the required resolution determine useful gradient conditions. Compare retention, peak shape, and separation when evaluating adjustments, keeping the column and other method variables controlled.
For batch comparisons, consistent C18 column dimensions and gradient timing help distinguish compositional changes from method variation. Record the column, gradient program, and observed peak profile with each run. Those details let researchers interpret whether a new peak or changed retention pattern reflects the sample or a changed chromatographic method.
Purity recommendations by research application
A useful purity target depends on what the peptide is intended to measure. Recommendations commonly distinguish screening from quantitative assays because sequence-related or chemical variants can affect receptor binding, biological performance, degradation behavior, or laboratory results. A high chromatographic percentage alone does not show that every impurity is irrelevant to the intended application.
Match the threshold to the assay
For quantitative assays, structural studies, and other demanding applications, a recommended target is greater than 95% purity. This level is also consistent with a common research-grade standard of at least 95% for general research. Sensitive assays may use a stricter benchmark, with common standards of at least 98% or 99%. The distinction matters when a small amount of a related species could affect a quantitative signal or structural interpretation.
For most qualitative and semi-quantitative biochemical assays, the recommendation is greater than 85%. Some screening and research applications use a target greater than 70%. These are application-based recommendations, not interchangeable labels: a screening result may tolerate more impurities than a measurement that depends on a controlled peptide concentration or defined structure. Choose the threshold by considering assay sensitivity and the consequence of impurity interference.
Consider impurity identity, not only percentage
Common peptide-product impurities include deletion or truncated sequences, incomplete deprotection, and byproducts from synthesis or final cleavage. A deletion variant has a different amino acid sequence and may have different biological activity from the intended peptide. Chemical modifications can also alter binding or degradation behavior. A purity decision should therefore account for the impurity profile and its likely relevance, rather than treating every minor peak as equivalent.
RP-HPLC provides a chromatographic profile of separated species, while mass spectrometry can add molecular-mass information. The techniques answer different questions: a peak-area percentage describes relative detector response, while mass analysis can help characterize a species. Purification may reduce detected impurities, but the required endpoint still depends on the planned application and the method’s ability to resolve relevant components.
Separate chromatographic purity from peptide content
HPLC area purity isn’t the same as net peptide content in dried material. Typical net peptide content in dried peptide products ranges from 70% to 90%; salts, water, and other non-peptide material can contribute to sample weight without appearing as peptide peaks. Quantitative amino acid analysis determines net peptide content, while RP-HPLC profiles separated components. For a quantitative assay, interpret both questions separately: how much correct peptide is present, and what related species does the chromatogram detect?
The practical takeaway is to set the purity criterion from the use case first. A screening study may use the greater-than-70% recommendation, while sensitive work may call for at least 98% or 99% and closer impurity characterization.
Peptide Store: Tirzepatide
Peptide Store supplies research-grade peptide compounds for laboratory and scientific applications, including Tirzepatide. Once you have defined the application-specific purity criteria and analytical methods, review the available compounds to support your research.
The catalog also includes Retatrutide, Semaglutide, and Cagrilintide. Keep analytical requirements distinct from compound selection: an HPLC purity result describes the integrated chromatographic signal under a particular method, while your experimental design determines which compound is relevant. Review available research compounds with those factors in mind.
For catalog information, visit peptidestore.store.
Carry Your Quality Criteria Into the Next Study
Build the analytical plan into the study design rather than leaving it until the final screening step. Define how the peptide will be evaluated, which attributes matter to the experiment, and how results will be recorded alongside sample identity. This gives you a clearer basis for comparing materials across experiments and interpreting unexpected variation. Peptide purity HPLC analysis can inform that evaluation, while compound selection should align with the research question and intended laboratory application.
For research involving these compounds, Peptide Store offers Tirzepatide, Retatrutide, and Semaglutide. Review the compounds relevant to your study and align your selection with established analytical criteria. This keeps procurement decisions connected to the experimental plan without treating a chromatographic percentage as a substitute for application-specific assessment.
Contact Peptide Store for help with your research compound inquiry. Proceed with a defined study plan and a clear basis for evaluating your results.
Frequently Asked Questions
Can HPLC distinguish stereoisomers?
It can, if the chromatographic method has sufficient selectivity for the stereoisomers. Standard reversed-phase conditions may not separate them because they share the same mass and often have similar chemical properties. A chiral stationary phase or a specifically optimized method can provide different interactions and improve separation. Mass spectrometry alone generally cannot distinguish stereoisomers by mass, so chromatographic evidence or another stereospecific technique may be needed.
Do regulators expect impurity identification?
For generic submissions, recurring or above-threshold peptide impurities are expected to be identified. The analytical focus is therefore not limited to reporting a main-peak percentage. For a peptide API, chromatographic resolution should support control of process-related and degradation-related species. In practice, the impurity profile and its relevance matter: a recurring peak or a degradation-related species warrants more attention than an isolated, unidentified signal.
What does TFA in the mobile phase do?
Trifluoroacetic acid (TFA) acts as an ion-pairing modifier in peptide reversed-phase chromatography. A typical mobile phase contains 0.1% TFA. By interacting with charged peptide groups, TFA can affect retention and peak behavior on the stationary phase. Its presence is part of the method conditions, so results from a TFA-based method shouldn’t be treated as directly interchangeable with results from a method using another acidic modifier.
Why do two labs sometimes report different purity numbers for the same peptide?
Different methods can produce results that vary by a few percentage points for the same peptide. Column chemistry, mobile-phase composition, pH, gradient, temperature, detection wavelength, and peak-integration settings can affect which components separate and how their signals are measured. For a meaningful comparison, examine the method conditions and chromatogram, not just the final percentage. A co-eluting impurity, for example, may be counted with the main peak.
How is peptide purity measured by HPLC?
HPLC separates components in a peptide sample, then a detector records their signals as peaks over time. Peptide analysis commonly uses UV detection at 214 nm or 220 nm. The resulting chromatogram is integrated to compare the target peak with detected peaks from other species. This measures chromatographic purity under the stated conditions. It doesn’t by itself determine the sample’s net peptide content or establish every peak’s chemical identity.
What HPLC column, mobile phase, and gradient are used for peptide purity analysis?
A common setup uses a C18 reverse-phase column, an acetonitrile-water mobile phase, and an acidic modifier such as TFA. Peptide columns commonly measure 50-250 mm long and 2.1-4.6 mm in internal diameter. A typical gradient raises acetonitrile from about 5% to about 60% over 15-60 minutes. The specific column and gradient are selected to separate the peptide from relevant related species.
How is peptide purity calculated from an HPLC chromatogram?
Calculate area purity by dividing the integrated area of the target peak by the sum of all integrated peak areas, then multiplying by 100. For example, a reported 99% means the major peak accounts for 99% of the integrated UV signal under that method. It doesn’t mean the dried sample is 99% peptide by weight. Integration choices and unresolved peaks can affect the reported result.
What are typical peptide purity acceptance criteria for research, pharmaceutical, and clinical use?
For research, recommendations vary with the experiment: greater than 85% is suggested for most qualitative or semi-quantitative biochemical assays, while quantitative assays and structural studies may call for greater than 95%. Sensitive research may use at least 98% or 99%. Pharmaceutical API assessment focuses on controlling relevant process and degradation impurities. Clinical-use acceptance criteria are product-specific, not defined by one universal purity percentage.


